Haider Waseem Anwar · PhD Candidate, Texas A&M Hazard Reduction & Recovery Center

Disaster data, analysed and mapped, with tools I built using agentic AI.

Each sheet below states the question, the data, the method and the tools, then shows the result. All code is in the repository, and every number is computed from public FEMA, USGS and UN data.

Python · pandas · statsmodels · SciPy · NumPy · GeoPandas · rasterio · xarray · DuckDB · Stata · SQLite · Streamlit · FastAPI · Playwright · Claude Code

No.ProjectDataMethod
Quantitative analysis
01Federal hazard mitigation grants, FY2015–2024OpenFEMA HMA Projectsχ², Welch ANOVA, OLS with HC3
Spatial analysis
02Pakistan earthquakes: origin vs impactUSGS ComCat, ShakeMapDensity, MMI composite, Gutenberg–Richter
03Texas flood claims and climateOpenFEMA NFIP, TerraClimatePayout-weighted density, bivariate
04Pakistan floods, 2010 and 2022UN OCHA, UNOSAT, CopernicusRaster overlay on 30 m terrain
05Pakistan temperature × rainfallTerraClimateBivariate classification
Agentic AI tools
06RFP Monitor17 procurement portalsScraping, scoring, Streamlit
07jobhunt12 job sourcesWeighted scoring, FastAPI

Quantitative analysis

Statistics on FEMA program data

  • $7.83B

    federal share obligated across 7,781 projects. Florida, Texas, Louisiana, California and Puerto Rico together received 53% of it.

  • V = 0.36

    The project mix depends strongly on the program (χ²(10) = 1,970, p < 0.001). FMA is dominated by home elevations and buyouts, HMGP carries most generator and warning projects, and BRIC/PDM leans to safe rooms and other structural work.

  • +96%

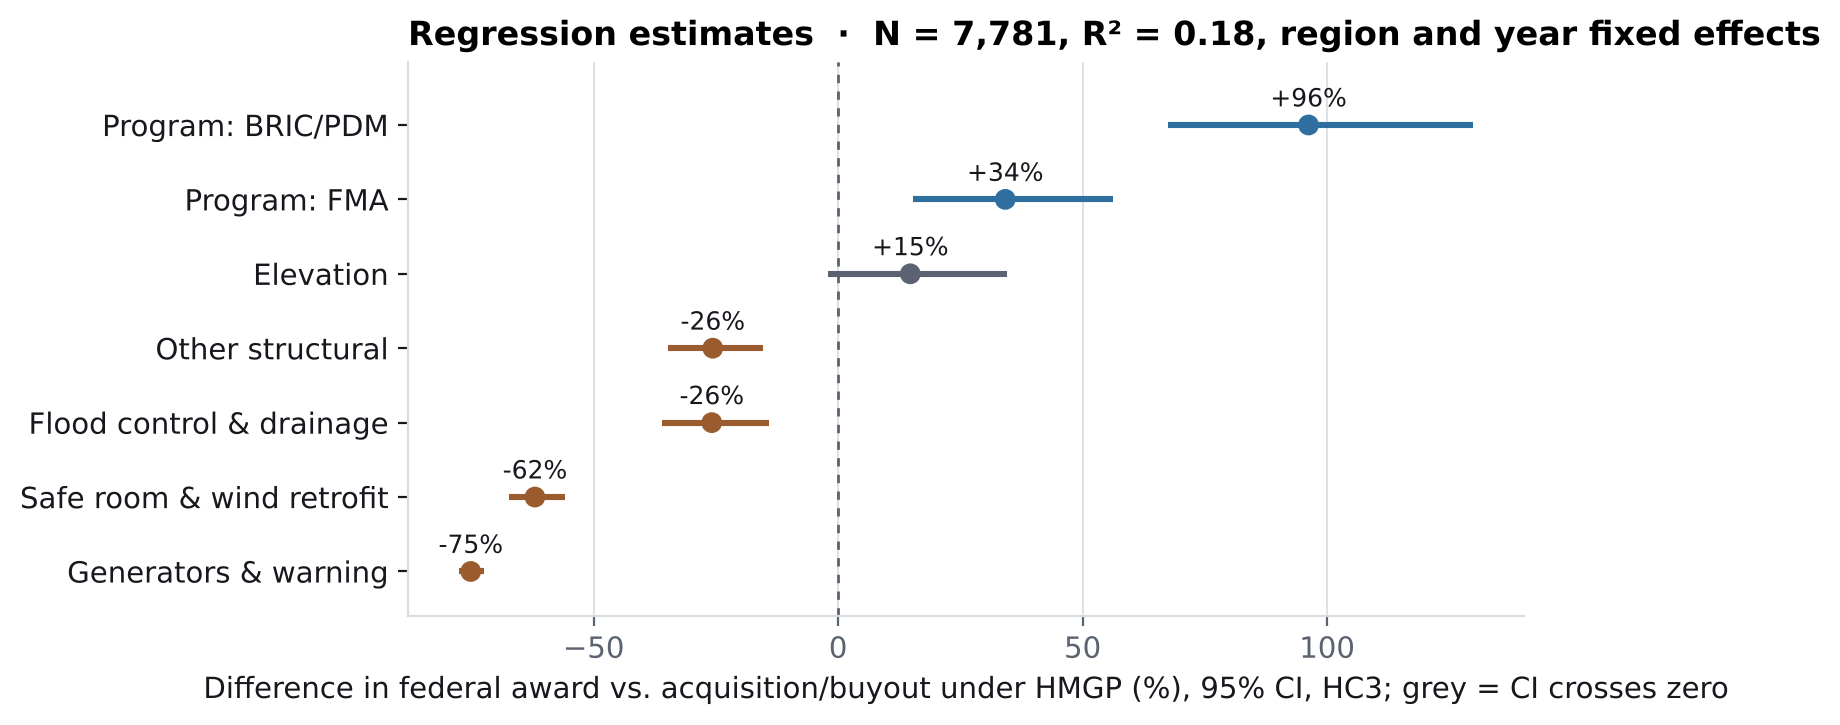
    A BRIC/PDM award is about twice the size of an HMGP award for the same project type, region and year (95% CI +67% to +130%; holds with state-clustered errors, p = 0.001).
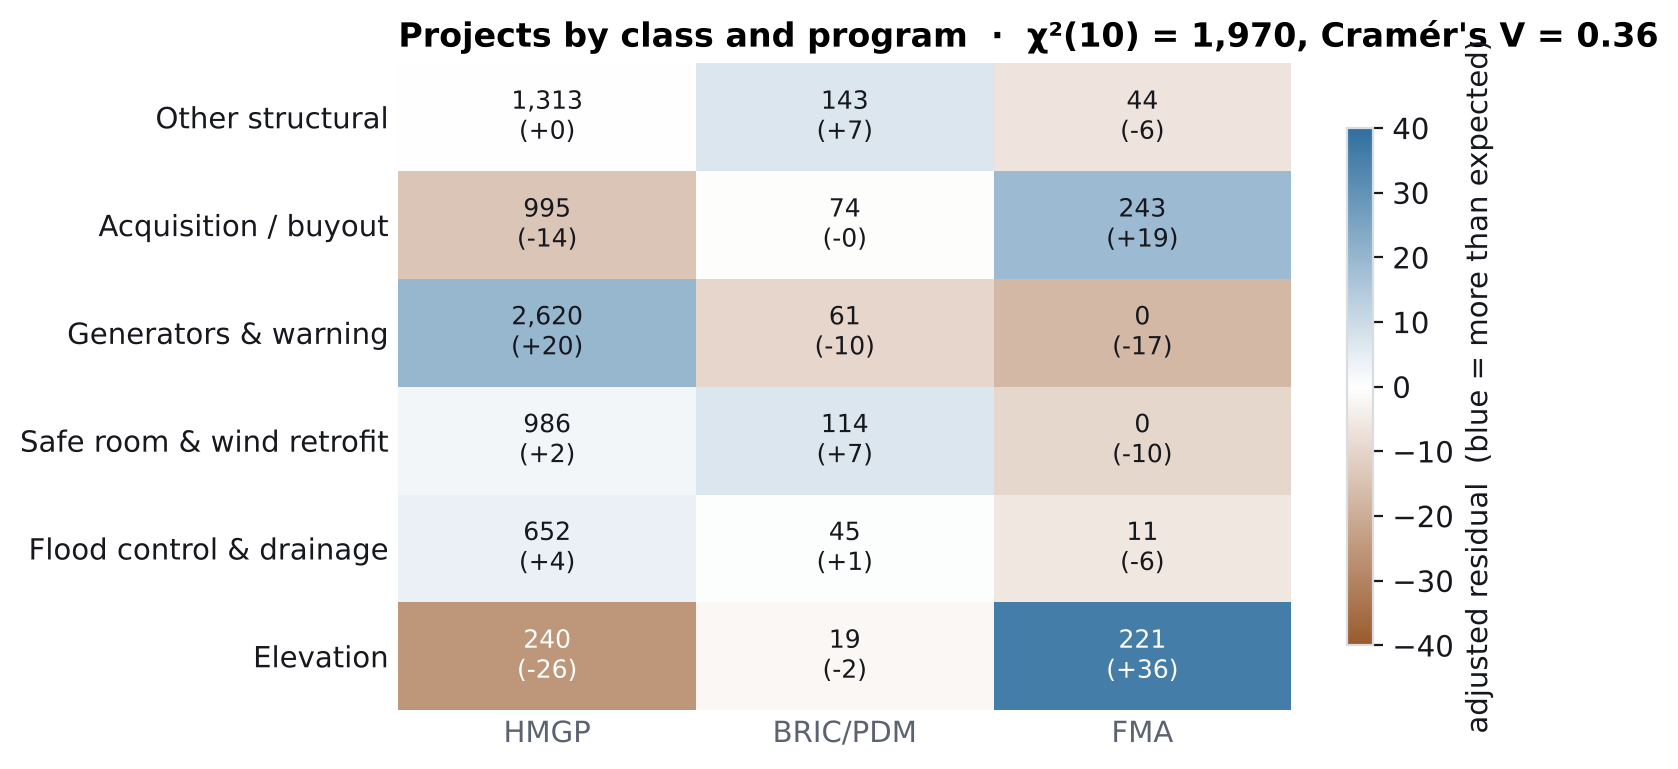
Heat map of project counts by class and program with adjusted residuals; elevation and buyouts are strongly over-represented in FMA, generators in HMGP.
Project class × program. Blue cells hold more projects than independence predicts.
Forest plot of regression estimates: BRIC/PDM +96%, FMA +34%, elevation +15% (not significant), generators −75%, safe rooms −62%.
OLS estimates as % difference in award, HC3 95% CIs. Region effects in Table 2.
Table 1. Federal obligations by project class, FY2015–2024
Project classProjectsFederal share ($M)Share of totalMedian awardProperties mitigated
Other structural1,5002,345.730.0%$379,79111,534
Acquisition / buyout1,3121,575.820.1%$406,1298,451
Generators & warning2,6811,179.015.1%$119,50852
Safe room & wind retrofit1,1001,014.613.0%$220,9936,406
Flood control & drainage708904.711.6%$392,115280
Elevation480810.010.3%$642,2874,238
Total7,7817,829.8100%30,961
Table 2. What predicts the size of a federal award (OLS, log federal share)
Term (vs. reference)Effect95% CI (HC3)p, HC3p, state-clustered
BRIC/PDM (vs. HMGP)+96%+67 to +130<0.0010.001
FMA (vs. HMGP)+34%+15 to +56<0.0010.084
Elevation (vs. buyout)+15%−2 to +350.0900.230
Flood control & drainage−26%−36 to −14<0.0010.206
Other structural−26%−35 to −15<0.0010.073
Safe room & wind retrofit−62%−67 to −56<0.0010.030
Generators & warning−75%−78 to −72<0.001<0.001
Region 8, Mountain West (vs. Region 6, South Central)−71%−76 to −66<0.001<0.001
Region 9, Pacific (vs. Region 6)−2%−16 to +150.8320.958

N = 7,781; R² = 0.18; fiscal-year and FEMA-region fixed effects. Regions 1, 3, 4, 5, 7, 8 and 10 receive 46–71% smaller awards than Region 6 (Region 2: −20%). Max VIF 2.45. Breusch–Pagan LM = 430 (p < 0.001), so inference uses HC3 errors. Cost share is excluded because federal share is cost × cost share. Several project-type effects lose significance under state clustering, so treat them as descriptive.
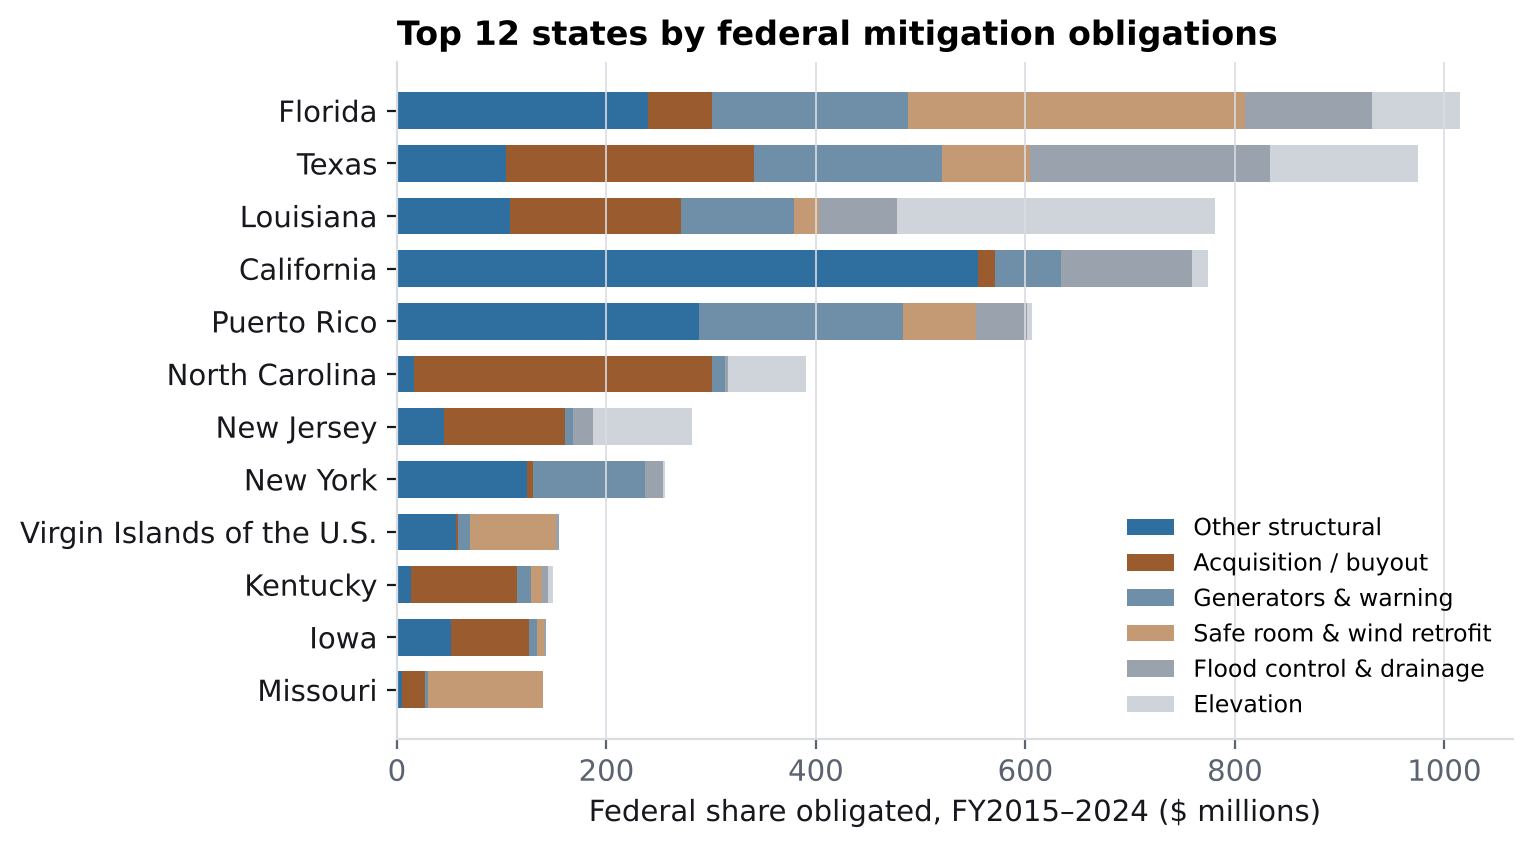
Stacked bars of federal mitigation obligations for the top 12 states, led by Florida, Texas, Louisiana and California.
Top 12 states by federal obligation, split by project class
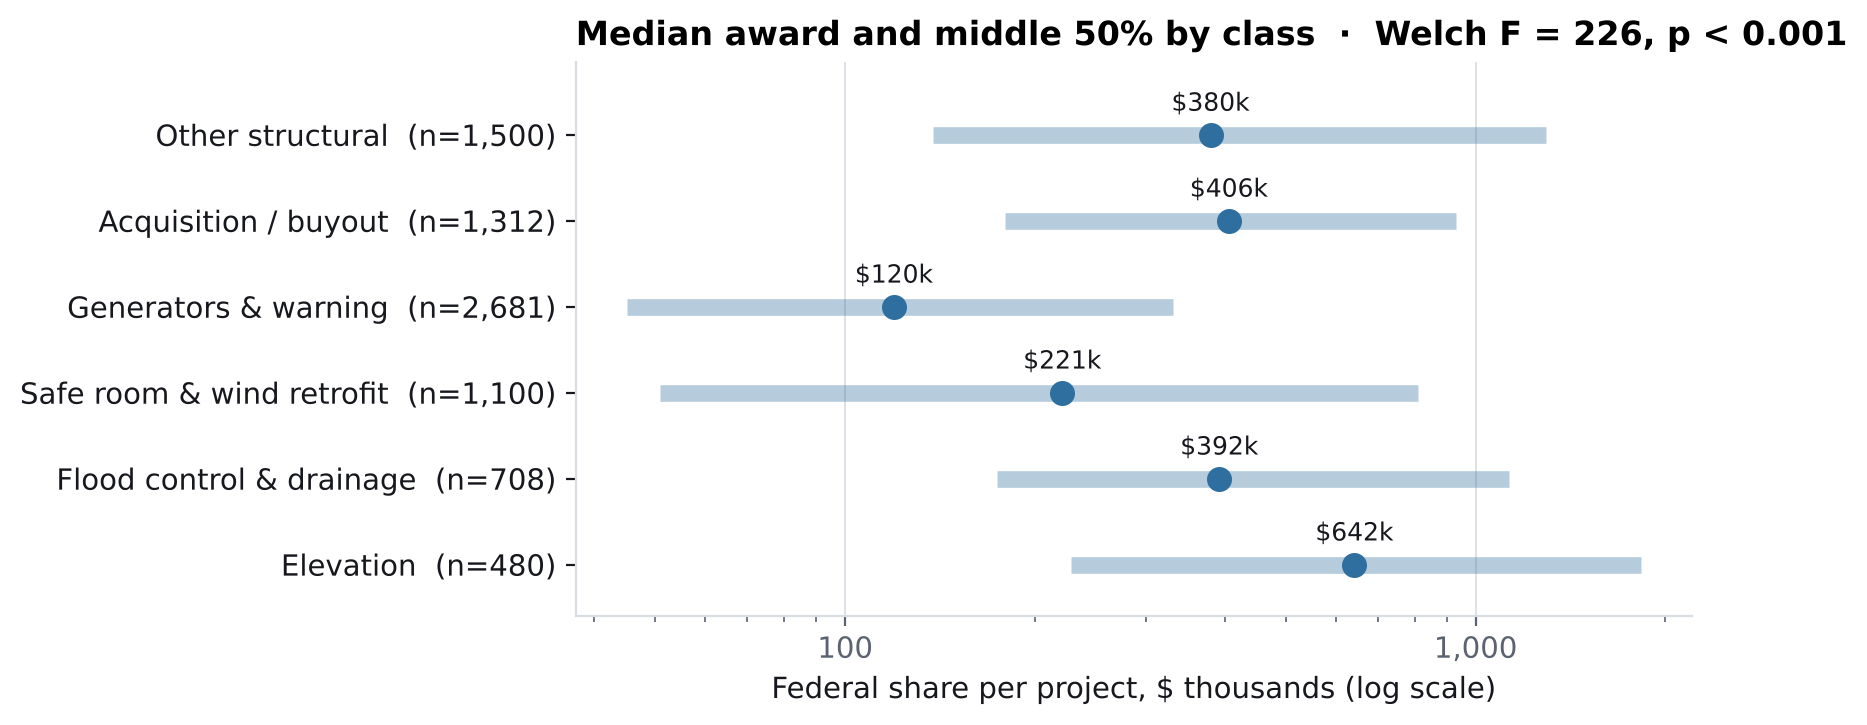
Median award by class with interquartile ranges; elevation has the highest median at $642k and generators the lowest at $120k.
Median award and middle 50% · Welch F = 226, p < 0.001

Limits: these are grant records, not outcomes. They show where money went and for what, not whether it reduced later losses. That needs loss data such as NFIP claims or FEMA's National Risk Index joined at county level, which is the next step.
Spatial analysis

4K relief maps rendered in Python; click any map for full resolution

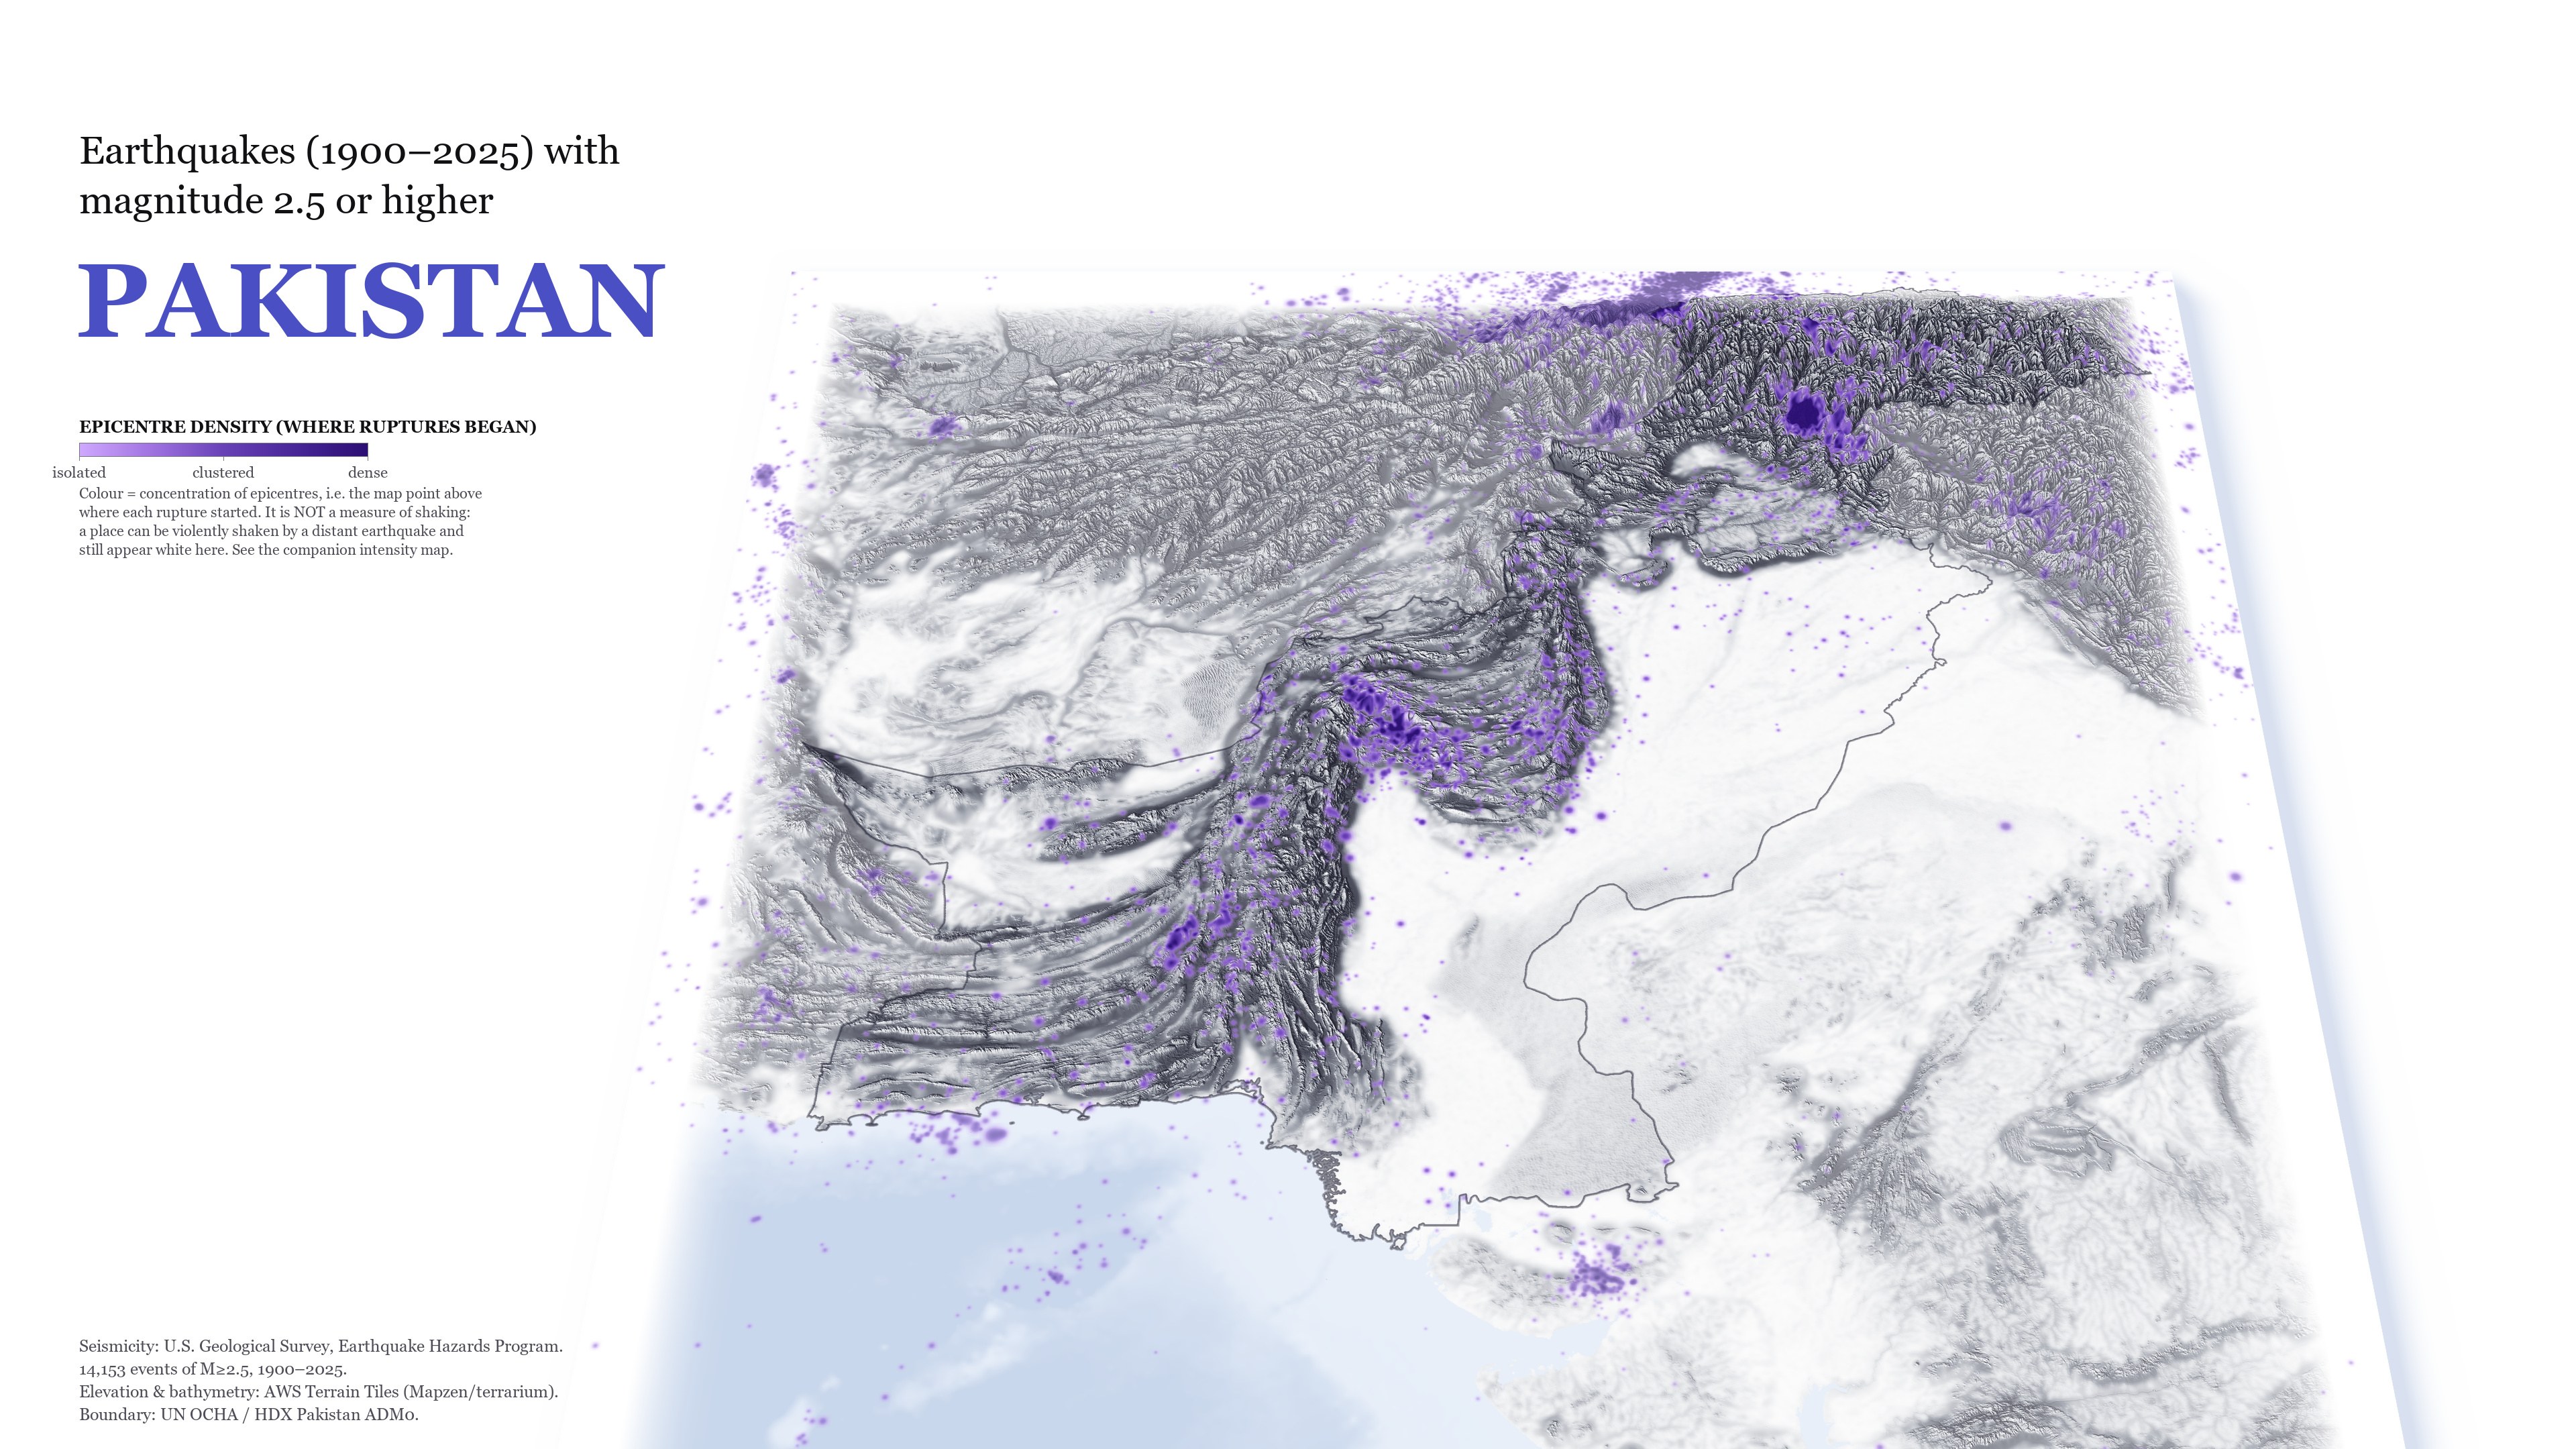
  • 61 vs 840

    epicentres in the Punjab plain vs. the Sulaiman–Kirthar belt at the same latitudes.

  • 98.4%

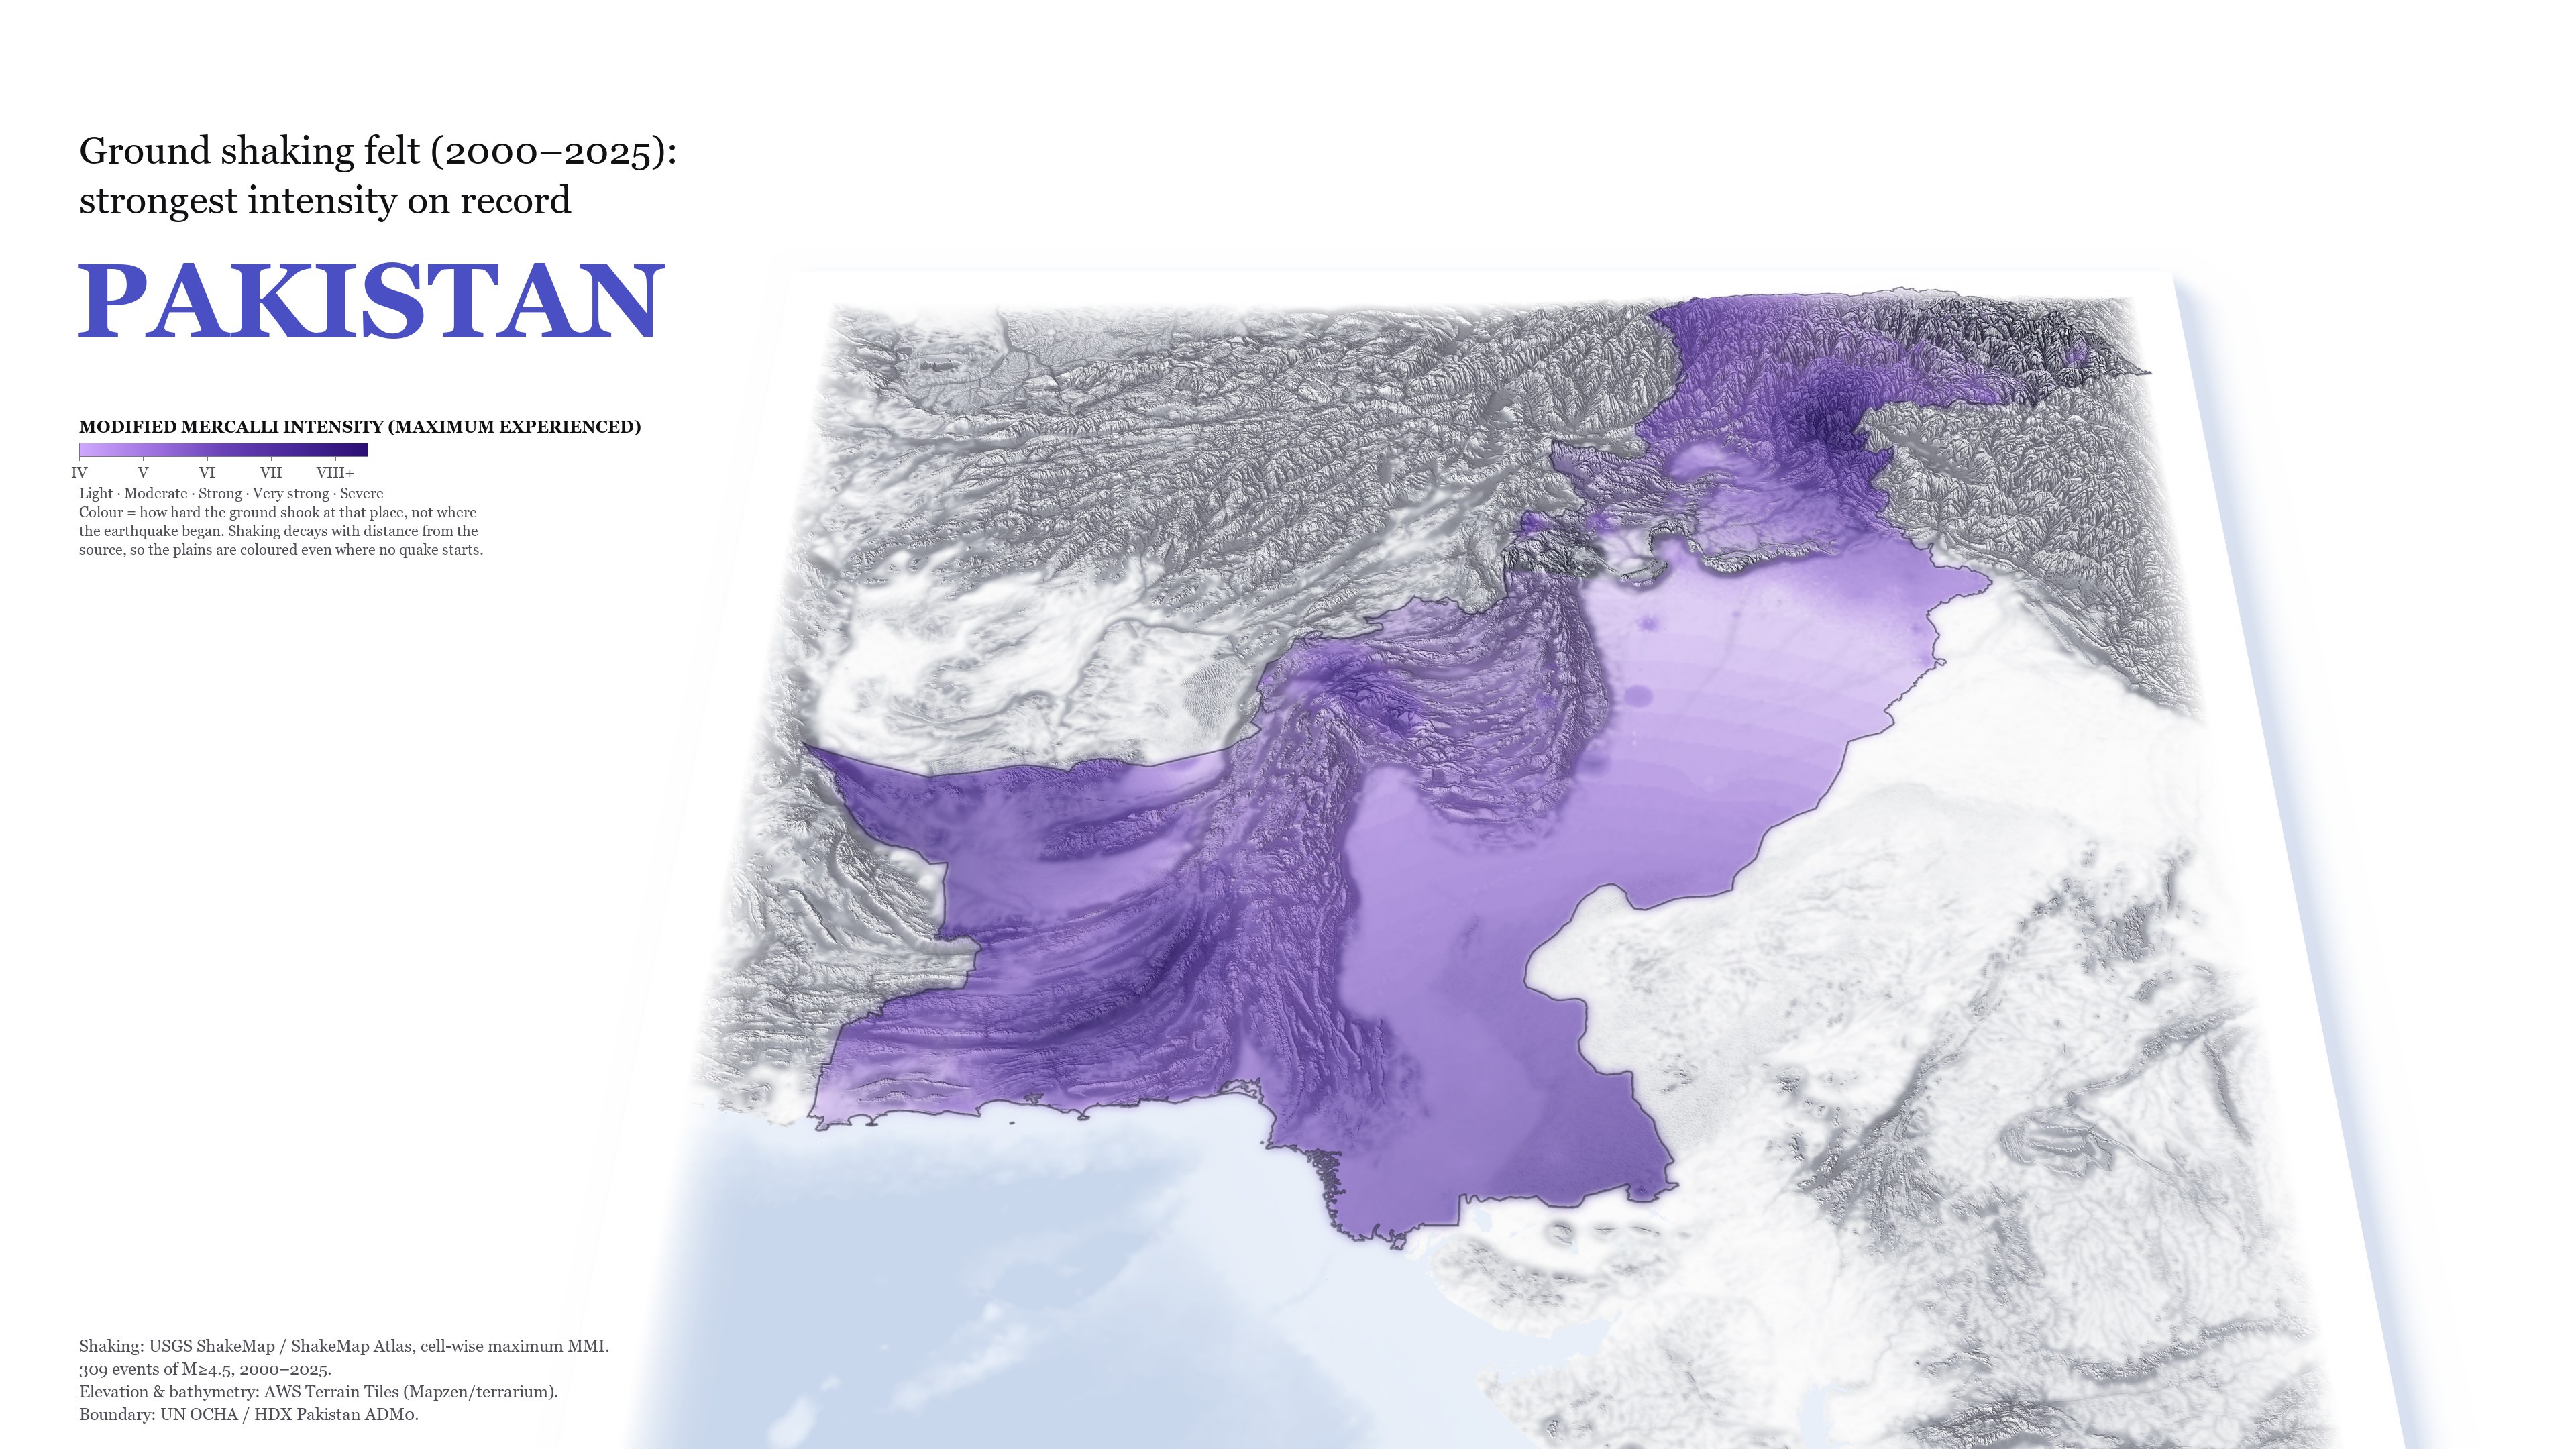
    of Pakistan has still felt at least MMI IV since 2000, and 28.9% has felt MMI VI or more. Lahore's strongest shaking came from a rupture 340 km away.

Relief map of Pakistan with earthquake epicentres clustered in the northern and western mountains; the plains are nearly empty.
Where ruptures began · M ≥ 2.5
The same map coloured by the strongest shaking felt since 2000; colour covers nearly the whole country.
Strongest shaking felt · max MMI, 2000–2025
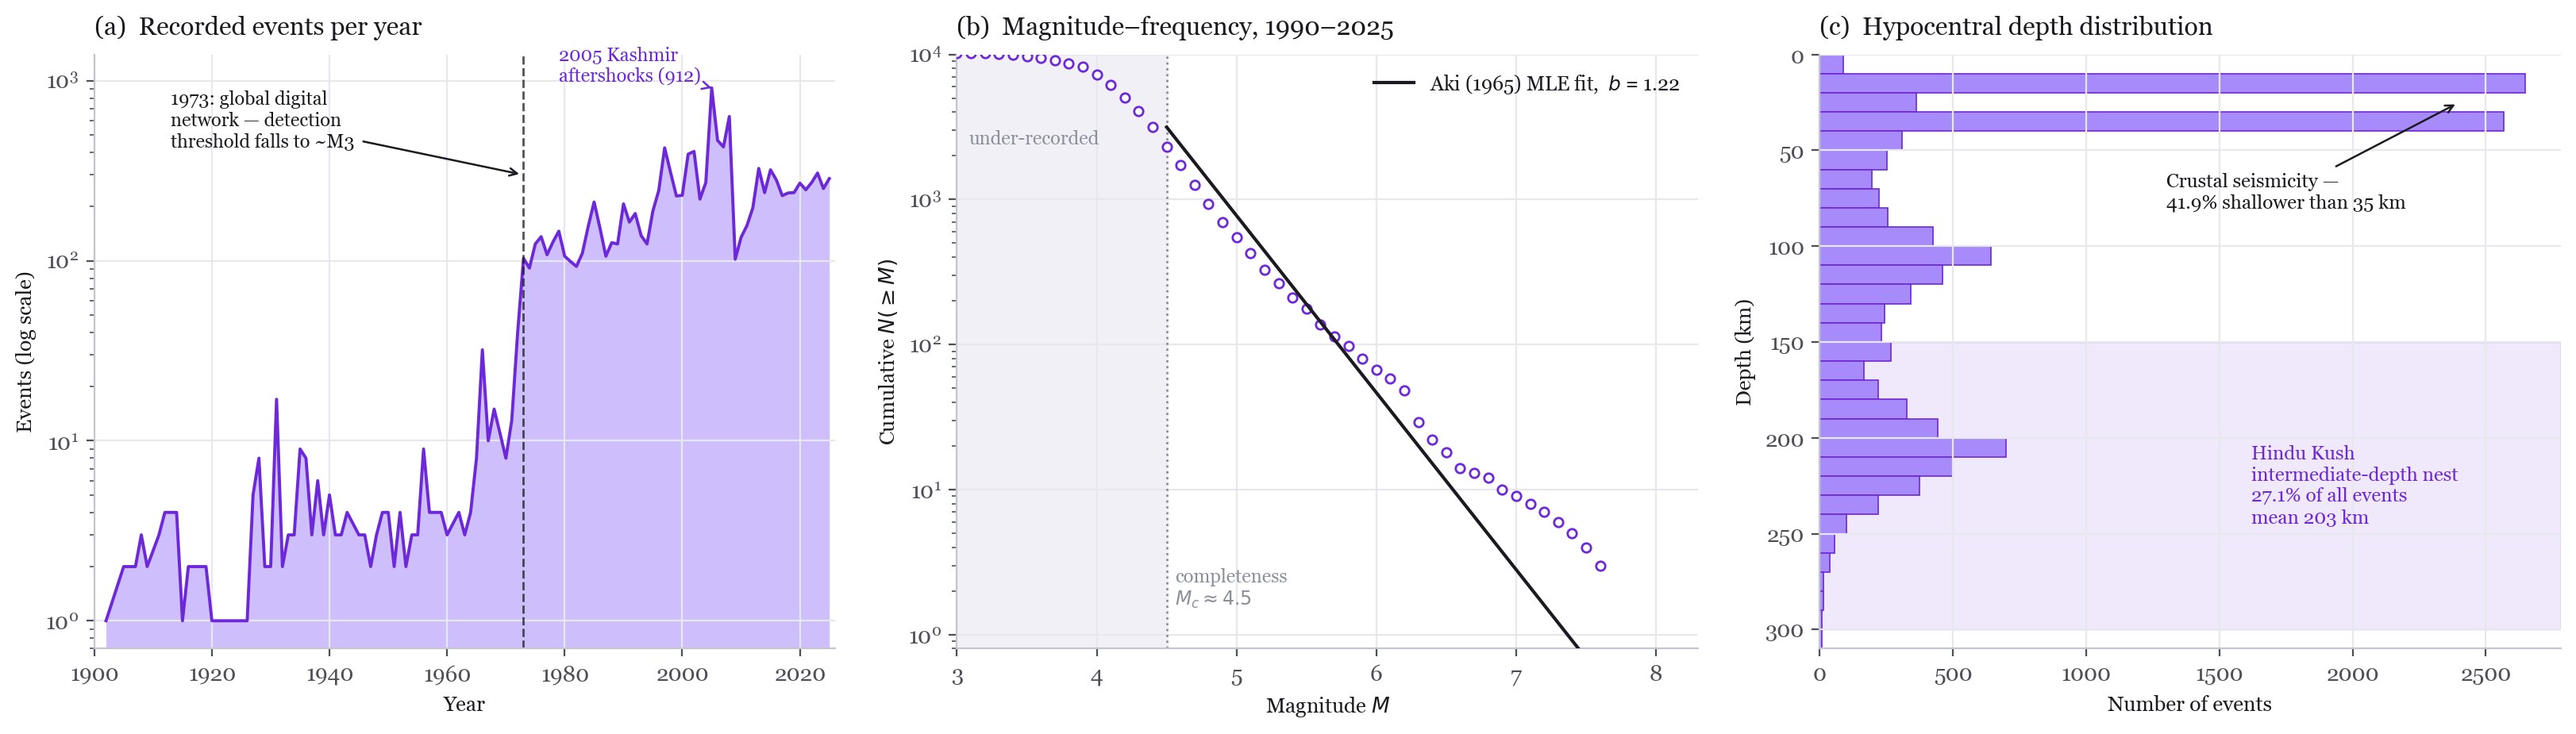
Three charts: annual event counts with a jump in 1973, a Gutenberg–Richter plot with fitted b-value, and a depth histogram.
Catalogue completeness, Gutenberg–Richter fit (Aki maximum likelihood), depth distribution

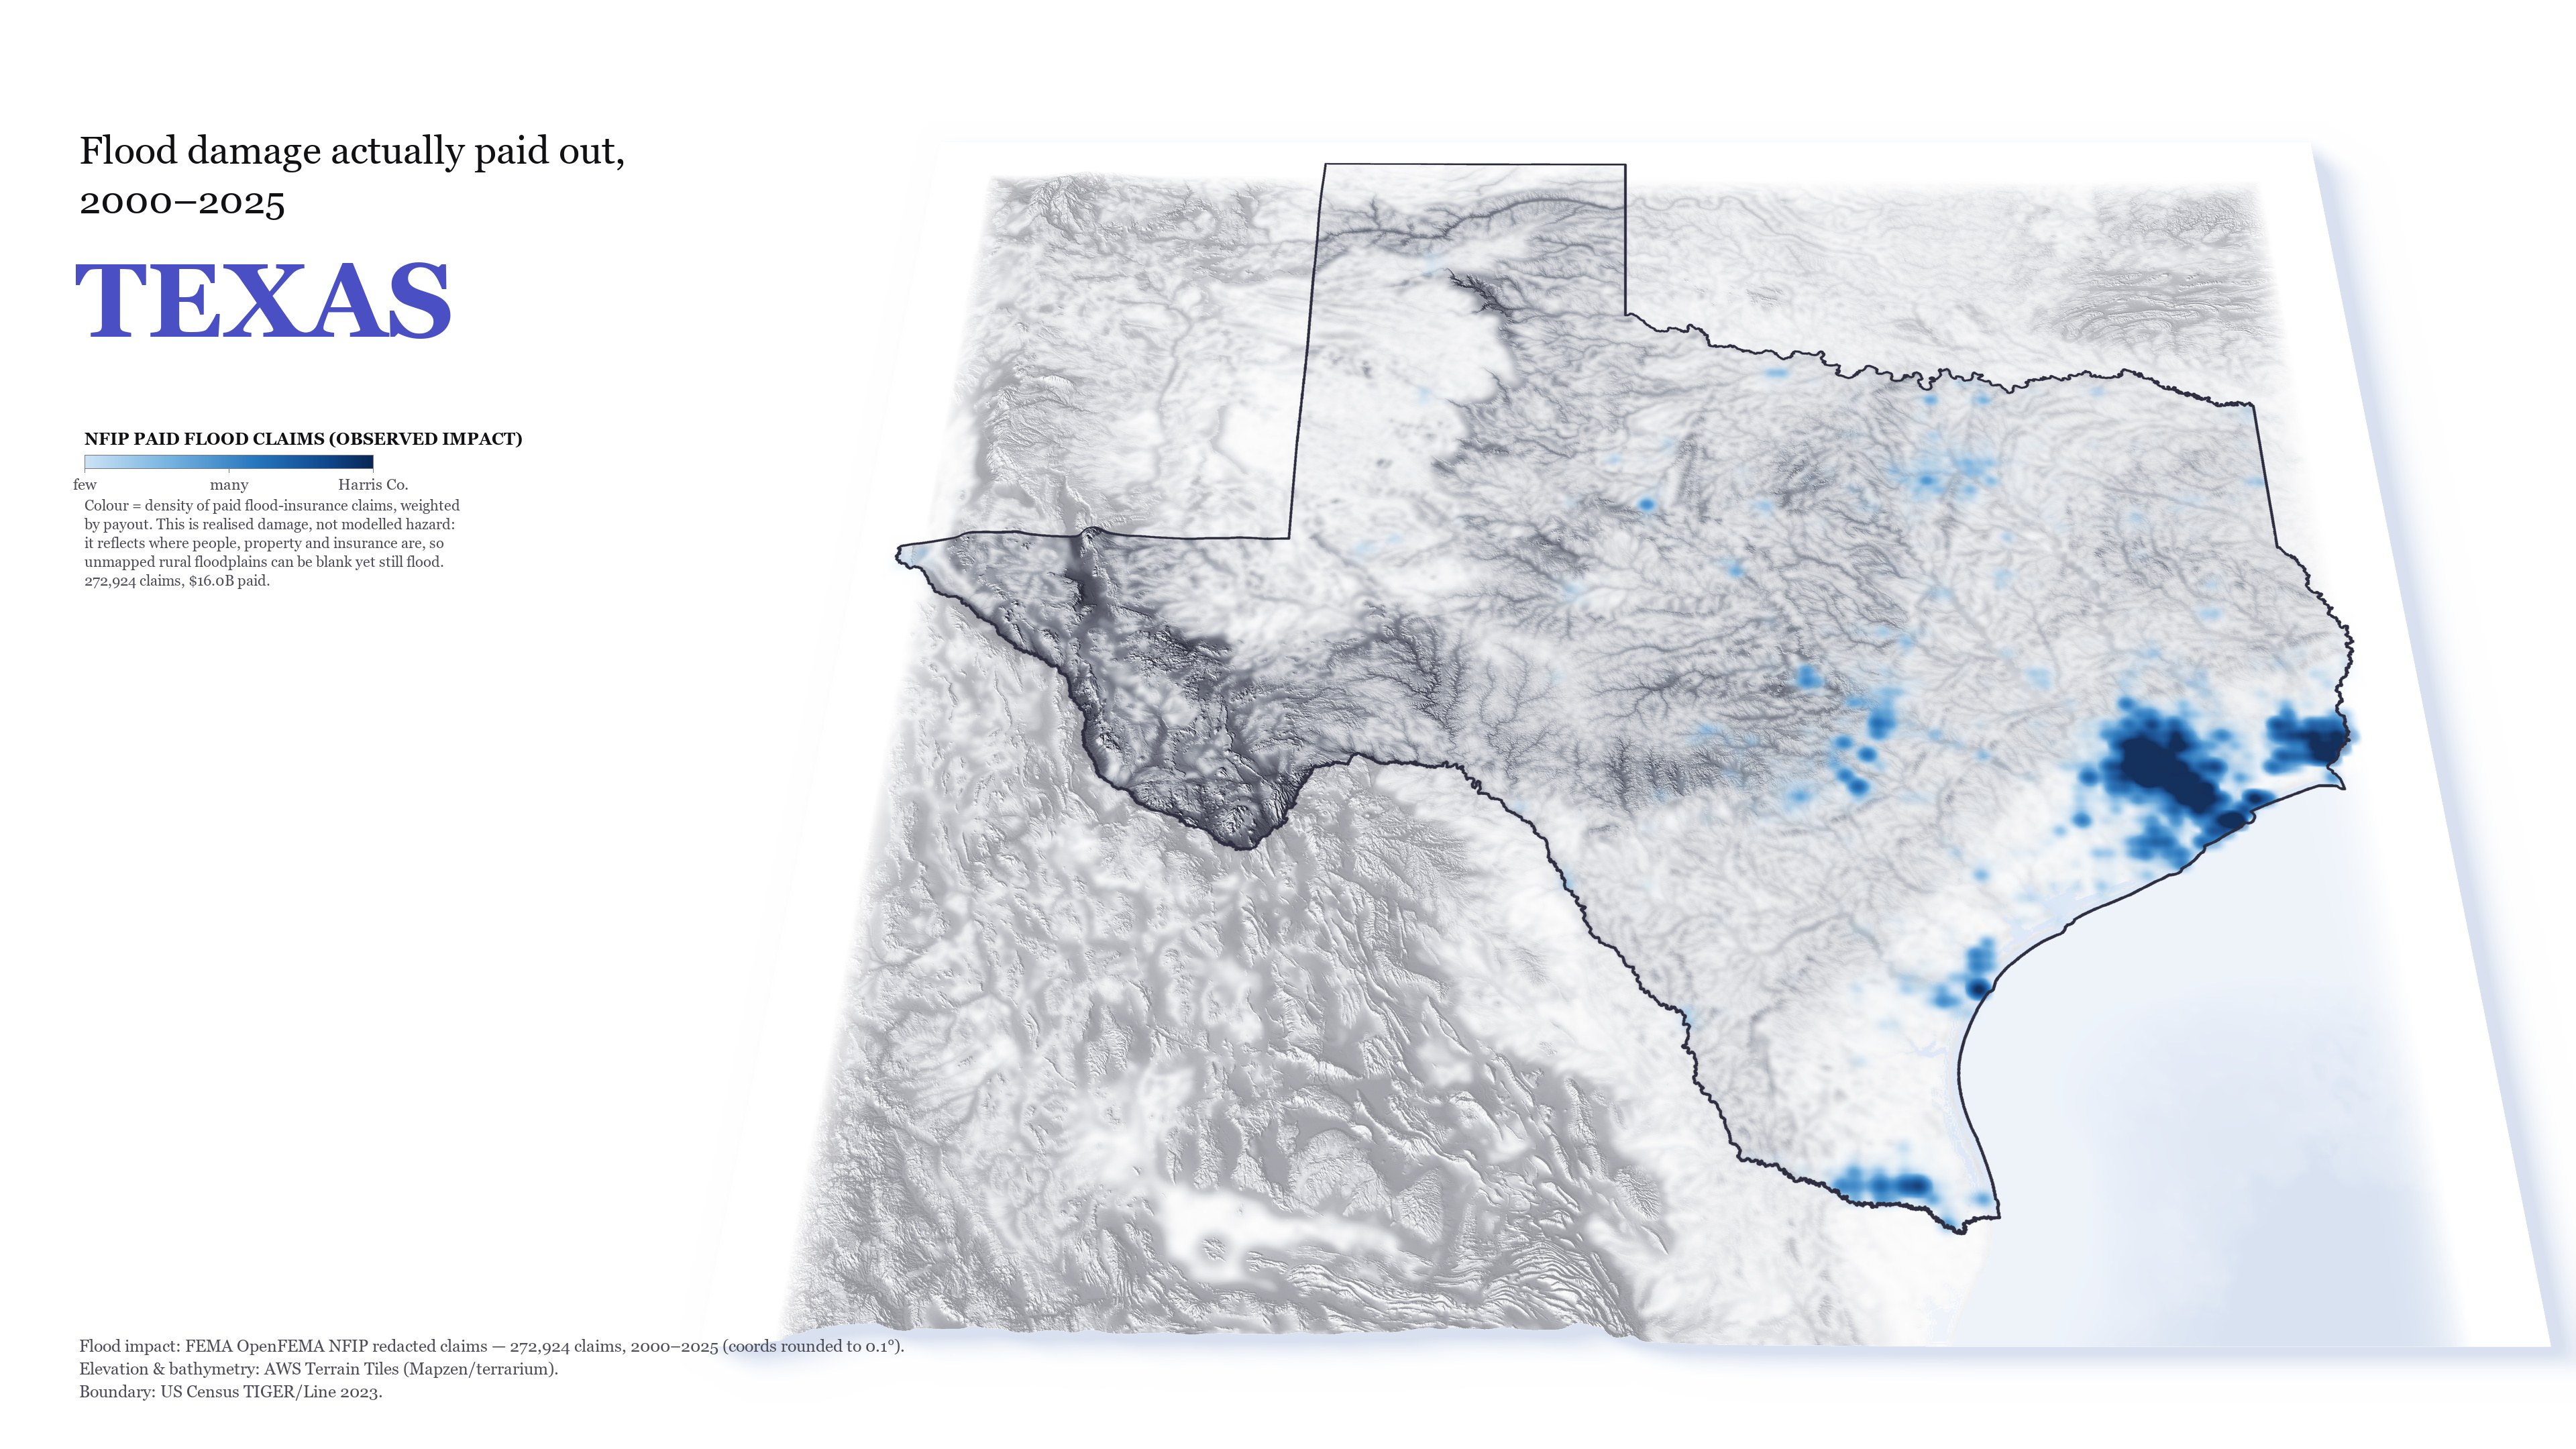
The flood map shows realised, insured damage rather than modelled hazard, so uninsured rural floodplains can appear blank and still flood. Harris County dwarfs every other cluster, so density is log-stretched to keep Beaumont, the Rio Grande Valley, Central Texas and Dallas–Fort Worth visible.

Relief map of Texas with paid NFIP flood claims concentrated around Houston.
NFIP paid flood claims, weighted by payout
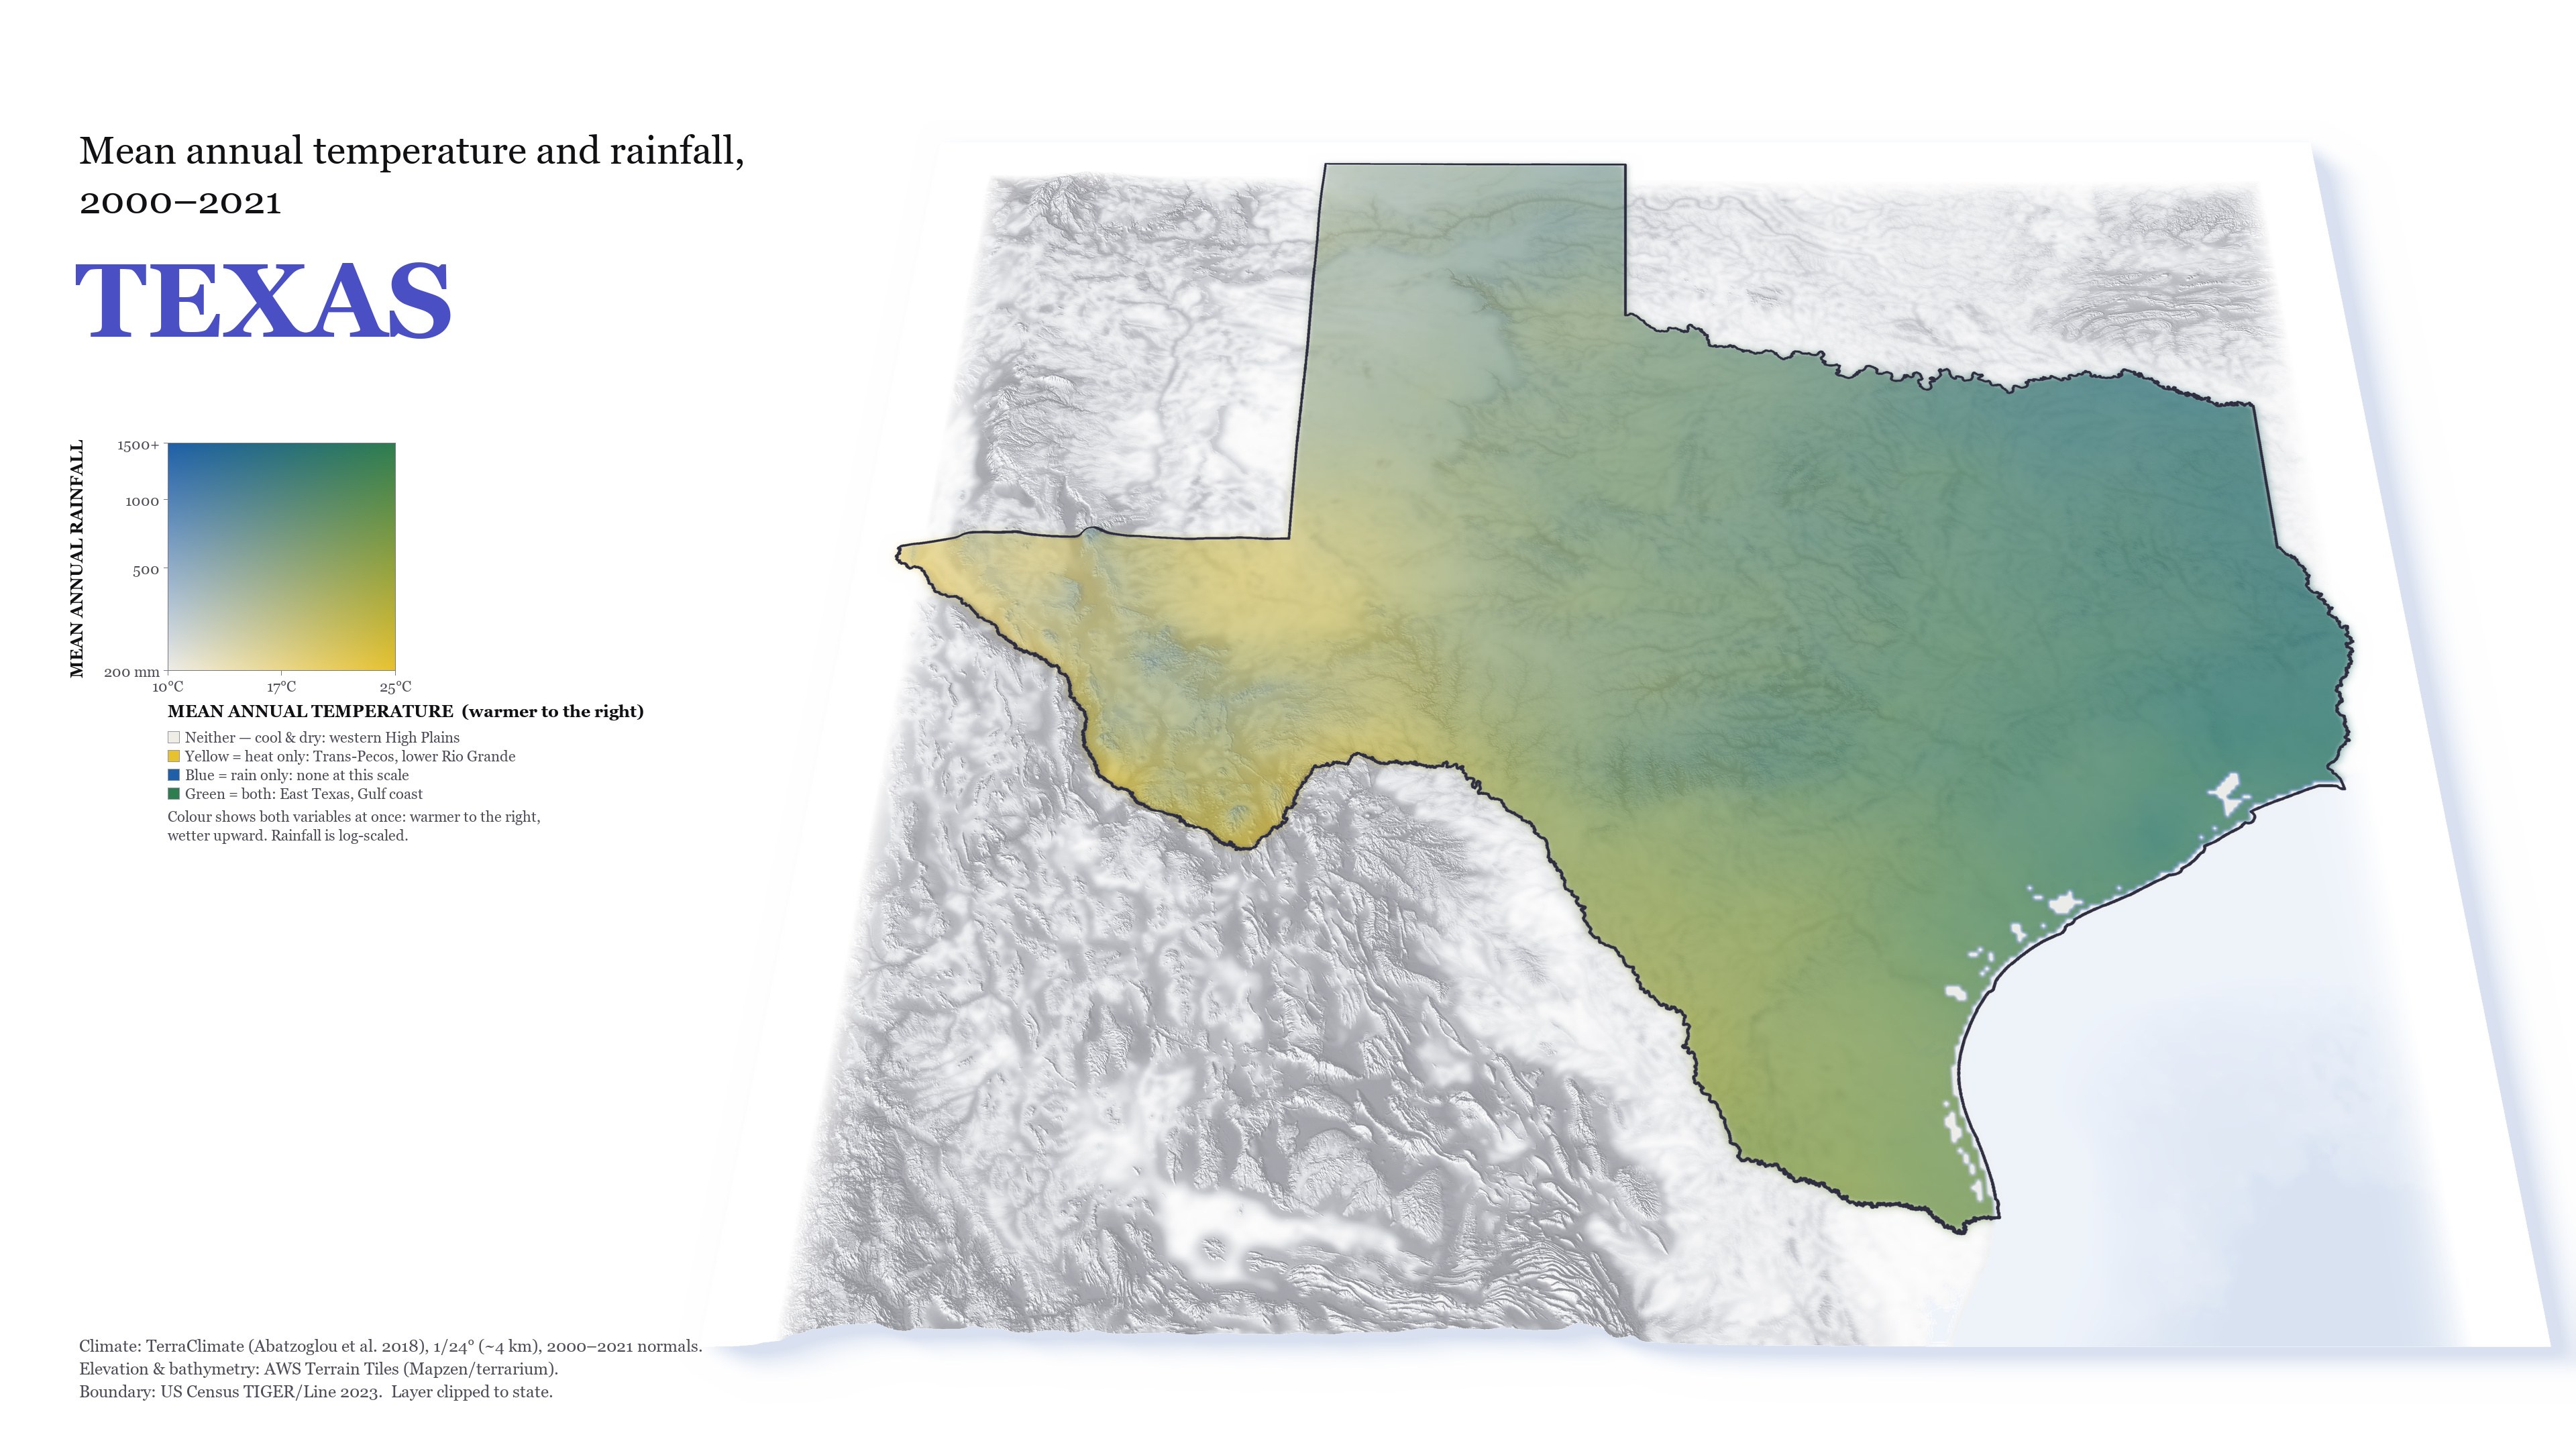
Texas coloured by temperature and rainfall: dry west, wet east.
Temperature × rainfall, 2000–2021

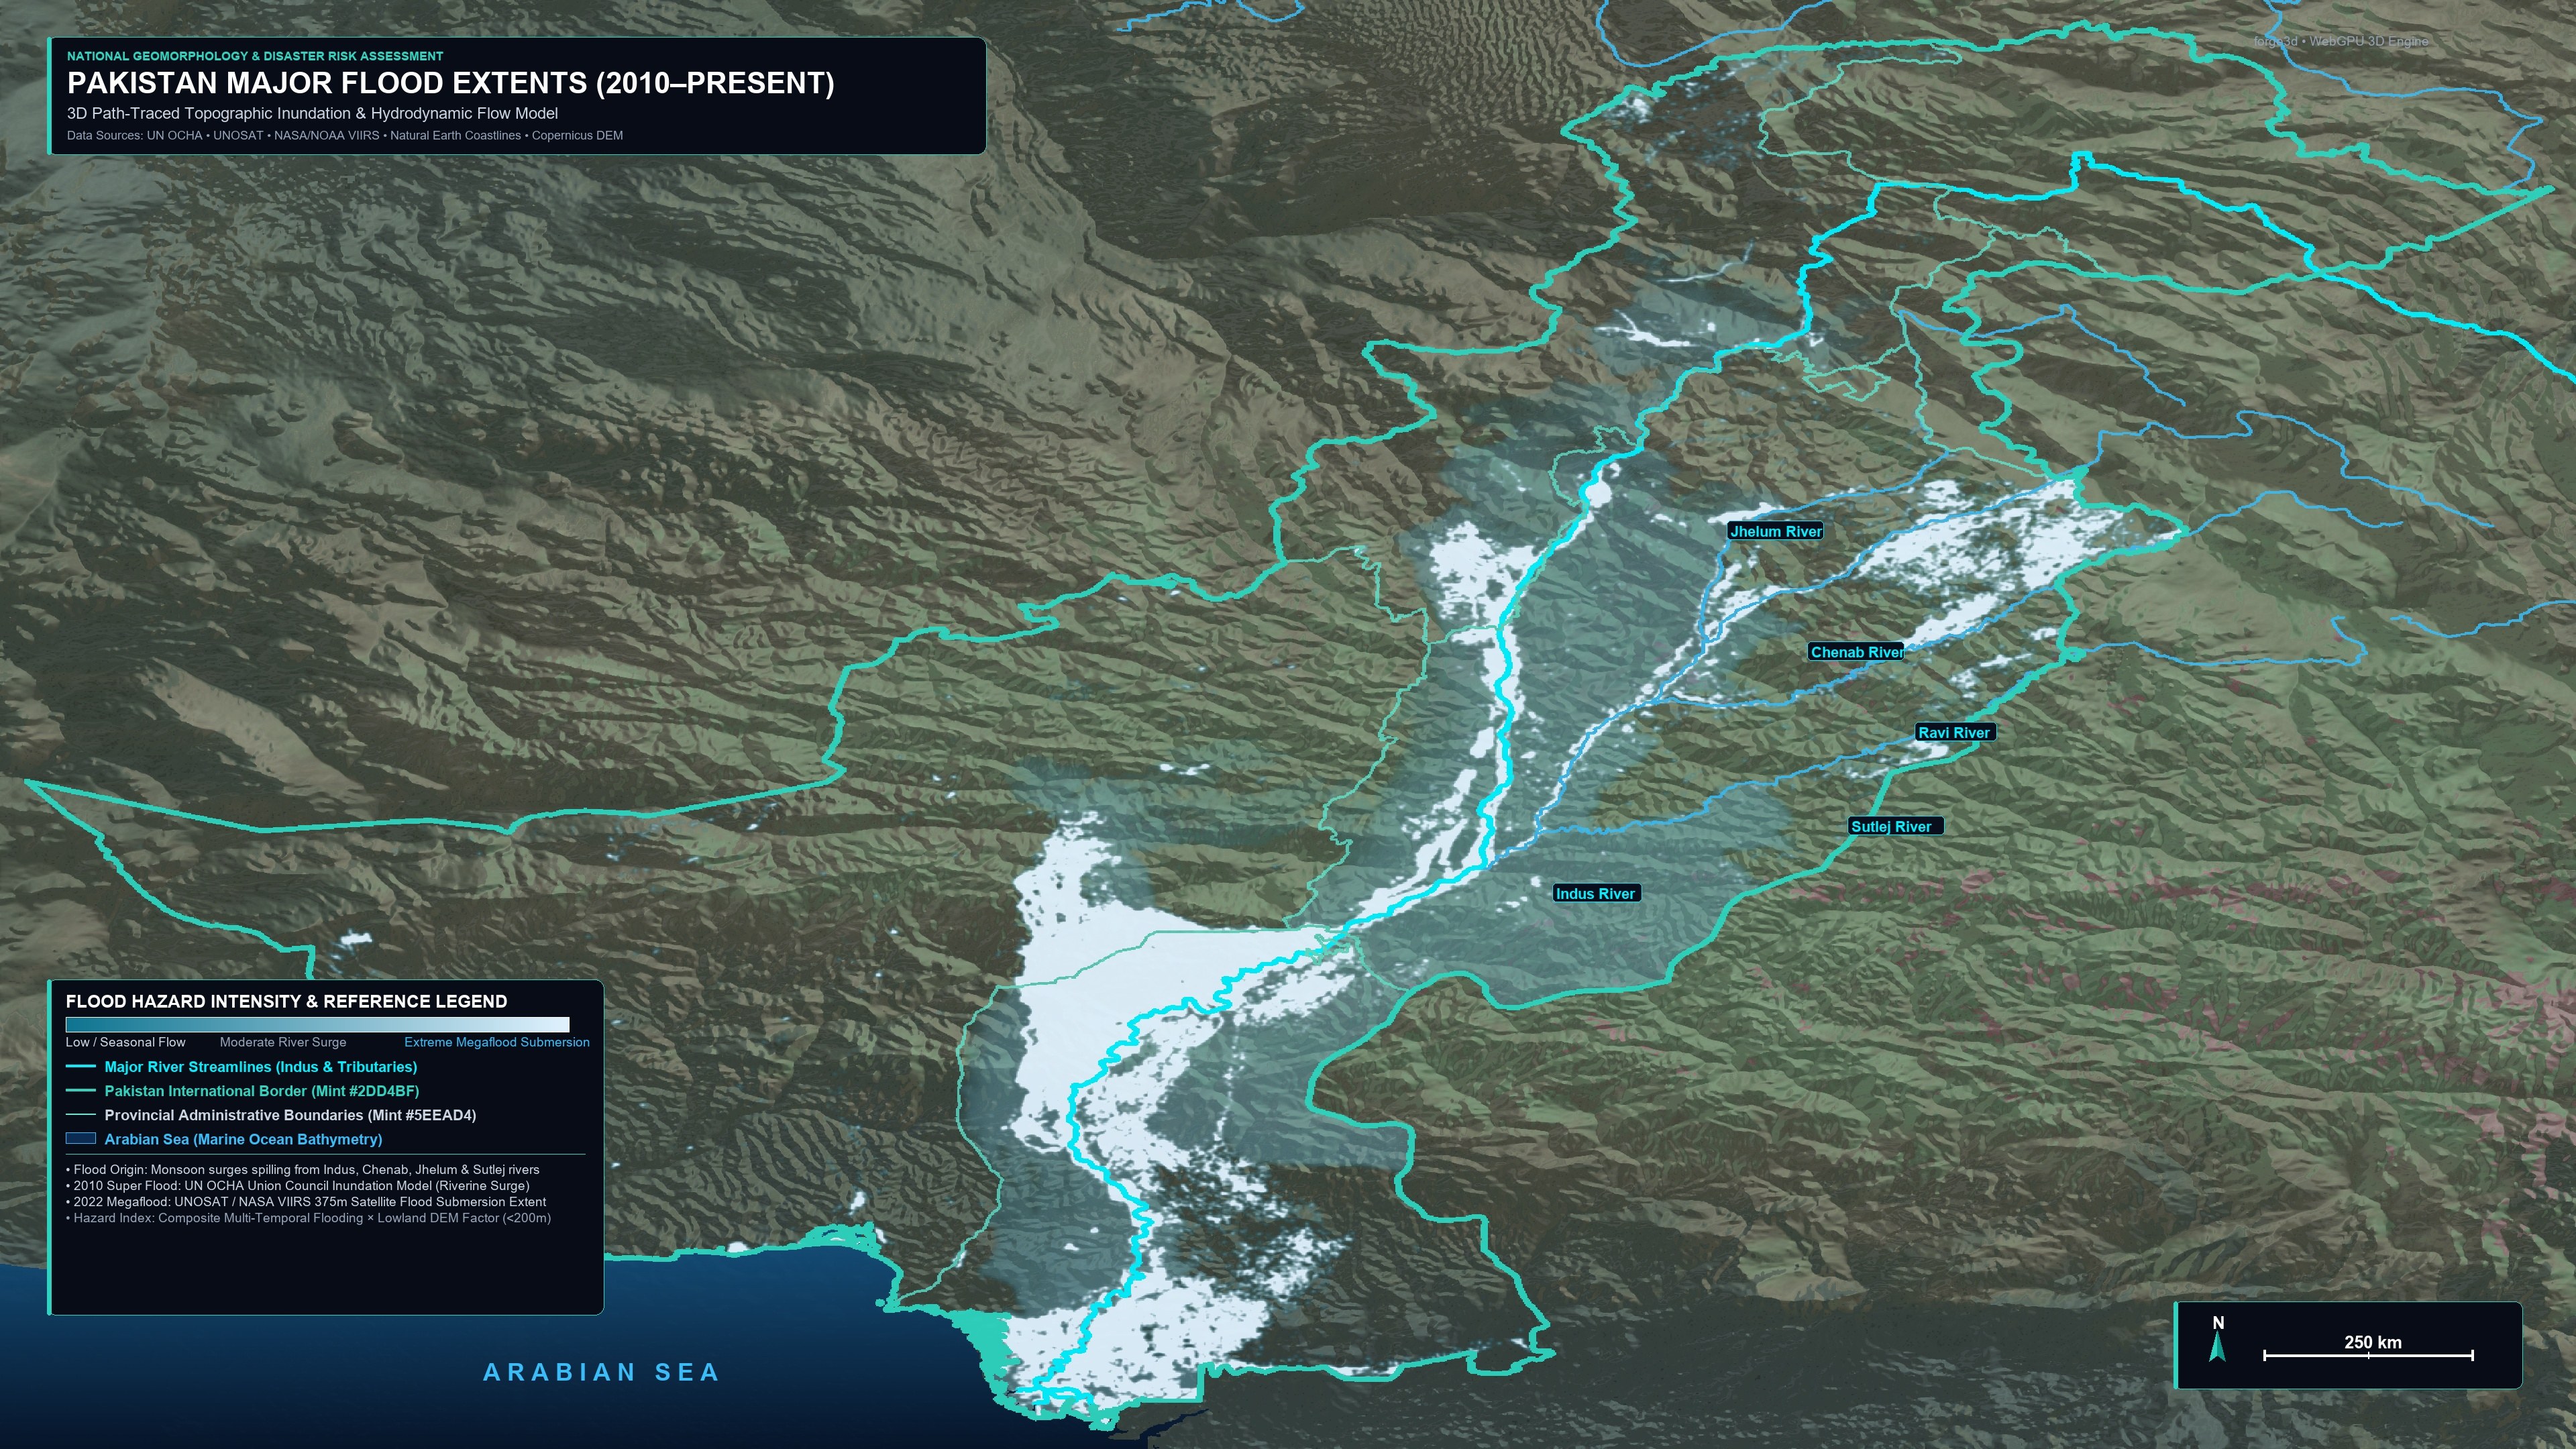
The 2010 flood travelled as a wave down the Indus from Khyber Pakhtunkhwa to Sindh. In 2022 rain fell directly on Sindh and eastern Balochistan and pooled for months between the Kirthar range and the river embankments. Both footprints concentrate on the flat lower Indus plain, the area I worked on for nature-based flood solutions at WWF-Pakistan.

3D terrain of Pakistan with 2010 and 2022 flood extents along the Indus and major rivers.
2010 and 2022 flood extents over 30 m terrain

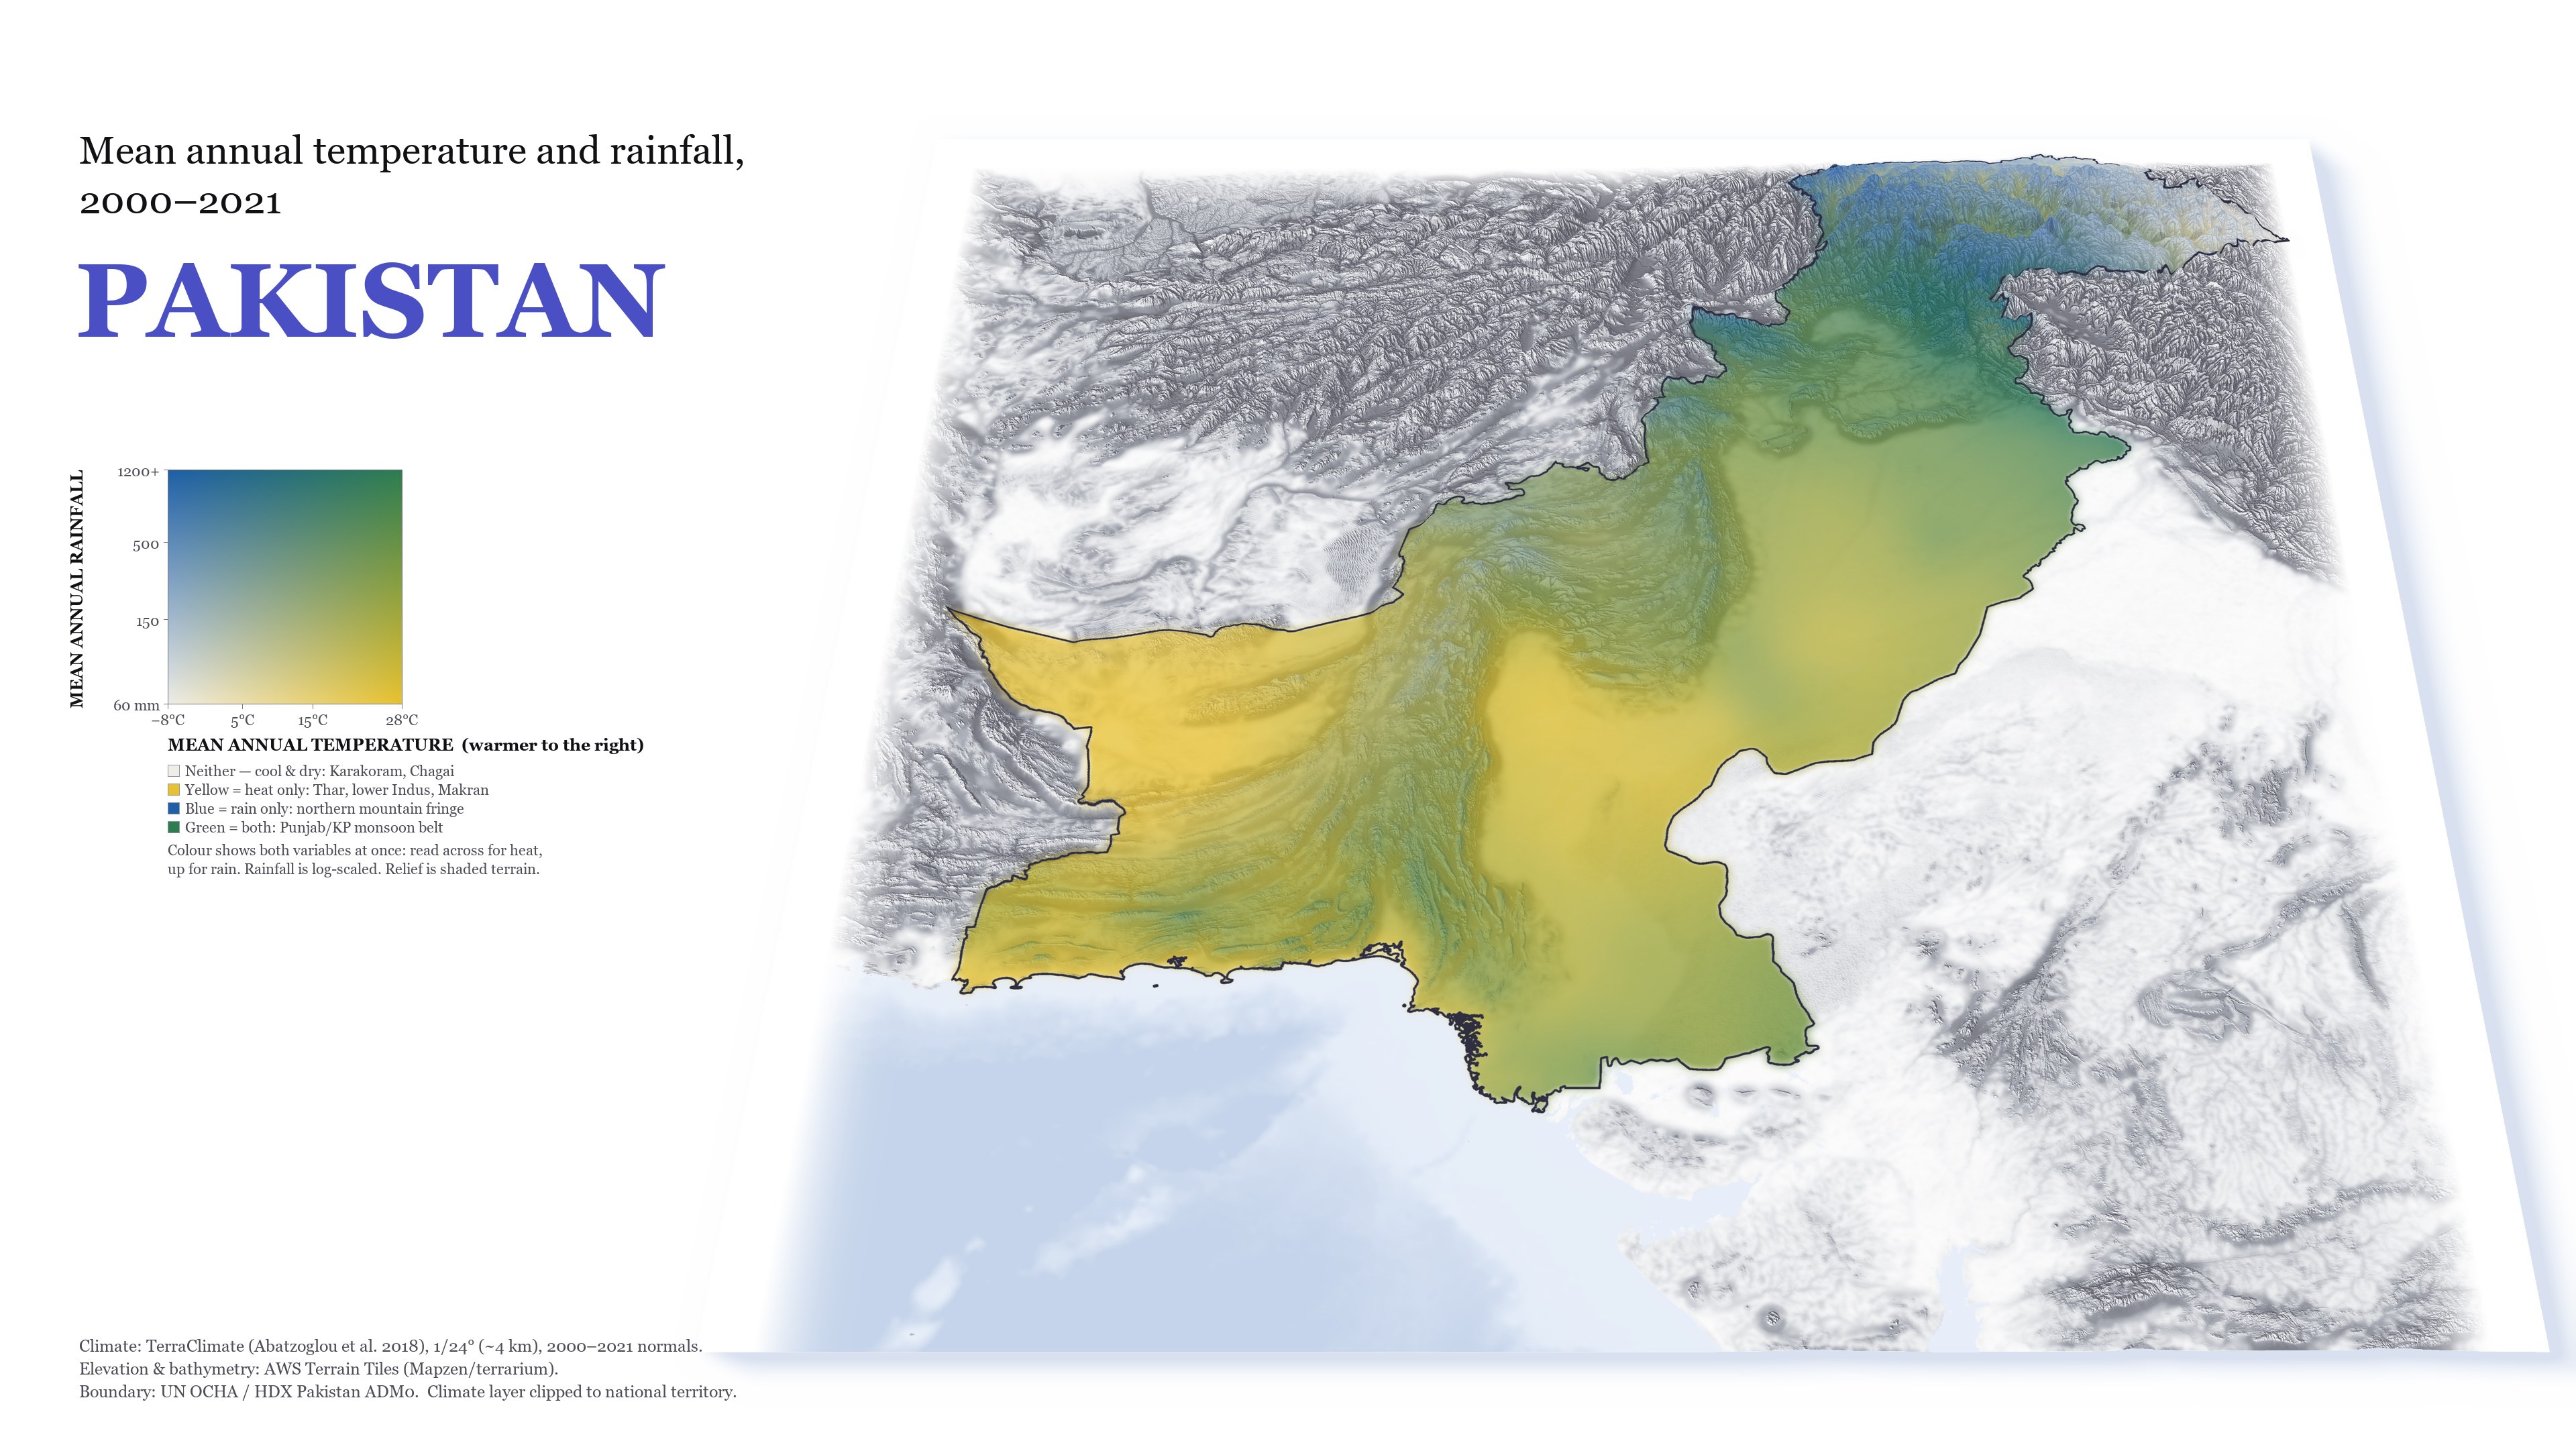
Four named corners: cool and dry (Karakoram, Chagai), hot and dry (Thar, lower Indus, Balochistan), cool and wet (northern mountain fringe), hot and wet (the Punjab and Khyber Pakhtunkhwa monsoon belt).

Relief map of Pakistan coloured by temperature and rainfall classes.
Mean annual temperature × rainfall, 2000–2021

Agentic AI tools

Built by directing Claude Code: I set the problem, sources and tests; the agent writes and runs the code; I review the results

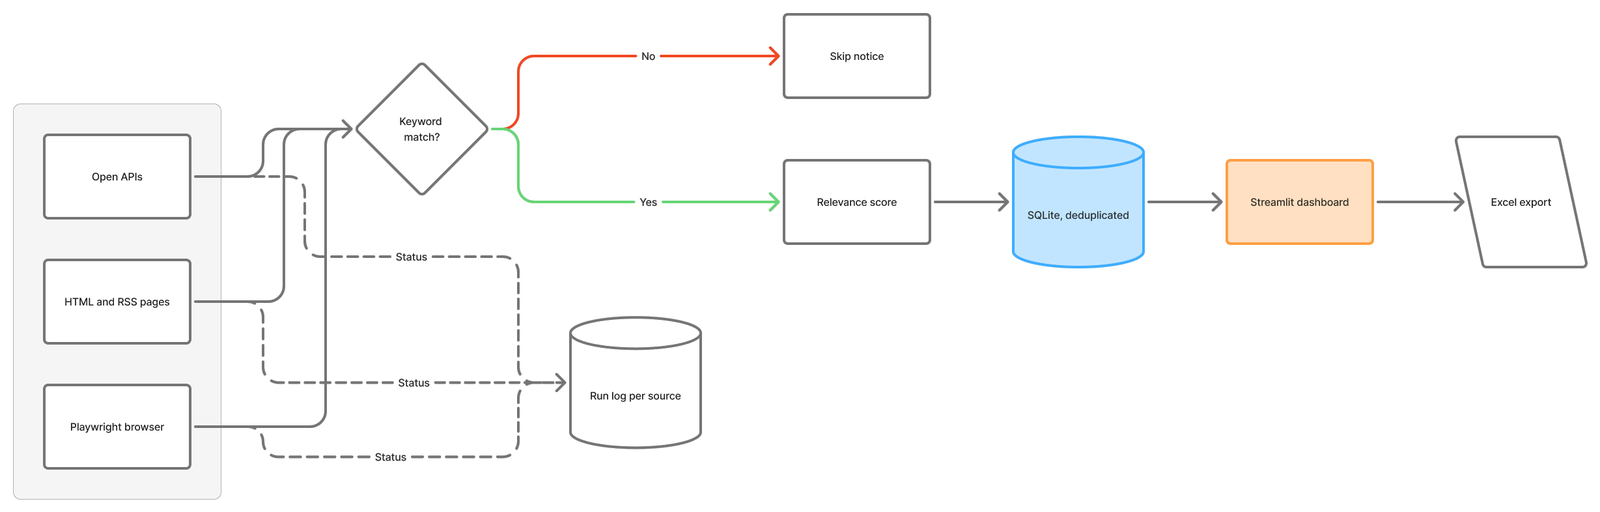
Flowchart: three kinds of sources feed a keyword match; matches are scored, stored in SQLite and shown in a Streamlit dashboard with Excel export; every source writes its status to a run log.
Pipeline (diagram built in FigJam)

Every check writes one log row per source (fetched, matched, new, status, error), and re-checks never duplicate or overwrite a notice. Grants.gov brings in US federal funding from FEMA, NSF, NOAA, HUD and DHS.

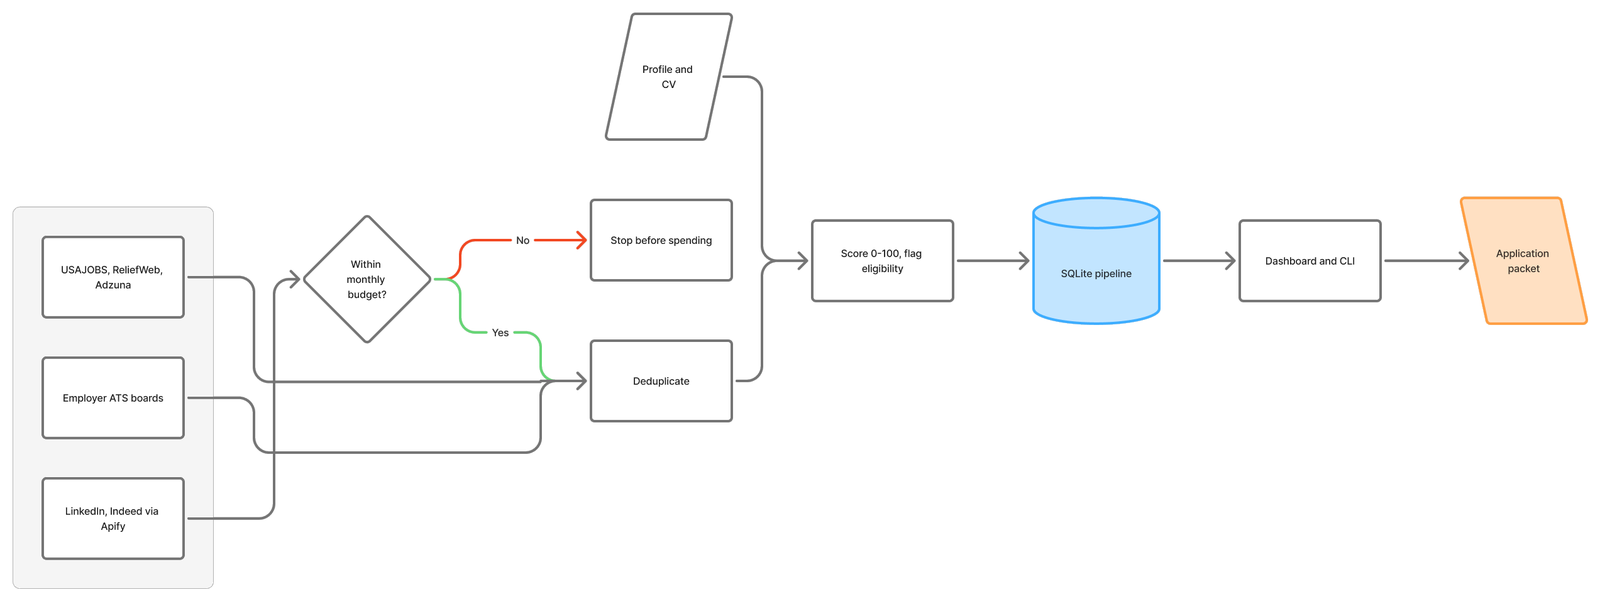
Flowchart: job sources are deduplicated, paid sources only within budget, then scored against the profile and CV, stored in SQLite, and turned into application packets.
Pipeline (diagram built in FigJam)

Scoring is a weighted model, not an LLM call, so rankings are stable and jobhunt show prints the arithmetic. A monthly cap stops paid scrapers before they exceed budget.